

How does the S&P500 work really?
Why long term growth of broad-based indexes work

This post does not have any alternative data in it, but I thought it was an interesting point to bring up when we are in periods of maximum pain. Understanding how the indexes work can help shape our perspectives on the future of growth.
There’s a reason that the S&P500 looks so good long-term…

This is because the index is continuously changing.
For lack of a better analogy - it is sort of like the Premier League. For those who are not soccer fans, unlike the MLB, NBA, and NHL - the composition of the league changes every year.
The bottom 3 teams are relegated to the next division, while the top 3 teams from the second division get put into the first division (the Premier League). This cutthroat nature brings some stiff competition - and just looking at recent success stories like Liescter City who won the league after being relegated with 5000:1 odds - the potential rise and fall of teams has enormous impacts - on themselves and the cities they are in.
Worth a watch:
Likewise in the S&P500 - the bottom companies are consistently getting relegated, while up-and-coming companies are joining. This makes some of these indexes extremely dynamic, and positioned for long-term growth.
This is just an interesting aside, but did you know that the S&P500 is not exactly rules-based?
Many don’t know this - but one of the biggest indexes in the world, if not the biggest - is not entirely rules-based. The criteria for inclusion are:
US Based company
Market cap > $14.6B
Trades on NYSE or ARCA
The monthly trading volume of >250,000 shares in each of the six months leading up to the evaluation date
Last but not least - based on committee decisions.
The committee comprises S&P full-time employees, all decisions are held confidentially and they can deviate from the rules of the index, which is different from other indexes such as the Russel 3000. They take into account other factors such as investor demand, market conditions, and other elements.

As a result - there is a slightly nuanced difference between this and other indexes - which actually makes it a bit active, albeit keeping some members from the actual index - and questions exist surrounding the bias involved, and even allegations of paying for ratings in order to be included - which is neither here nor there, just interesting data to piece this world of ours together.
This is the change in sectors over time, and I bring this up - from an optimistic point of view - because we are not just buying the same components every time we buy an index like this, but rather we are actively re-upping and representing the best of future growth, and eliminating “the losers”.
Rebalancing happens every quarter, and so in the short term, some major pain can be felt during periods of stress, but zoom out a bit - and that’s truly where the magic happens.
This is the change in GIC sectors of the S&P500 over time.

Why does index inclusion matter?
Automatic bids. Indexes that follow you have to buy your stock, which leads to large amounts of liquidity when it’s time for you to enter, and continue on thereafter - and when it’s time to leave - well you get it. All of this serves to amplify these events.
Here is an example of recent companies that were removed and added. This is from the most recent change announcement

Added - ON Semiconductor
Removed - Under Armor

Is the amplification effect helping or hindering?
Just think about this. ON Semiconductor got included in the S&P500 recently - as mentioned above.
The market cap was roughly 20B prior to the inclusion in the index.
Let’s assume a 0.05% weight - which is on the lower end of the index. The 3 biggest ETFs that track the S&P500 are:
State Street (SPDR) - $330B AUM
Vanguard (VOO) - $766B AUM
iShares (IVV) - $288B AUM
That would be an additional ~700M in liquidity on day one of inclusion, not including the larger indexes, active funds, mutual funds, and other assets. That’s the amplification effect - as they issue more stock, notes, and other instruments, they know there is an efficient another side to level up their growth.
An interesting point to watch is the lifespan of the companies in the S&P500 - and this rings true for most other indexes as well. It has gotten shorter over time.
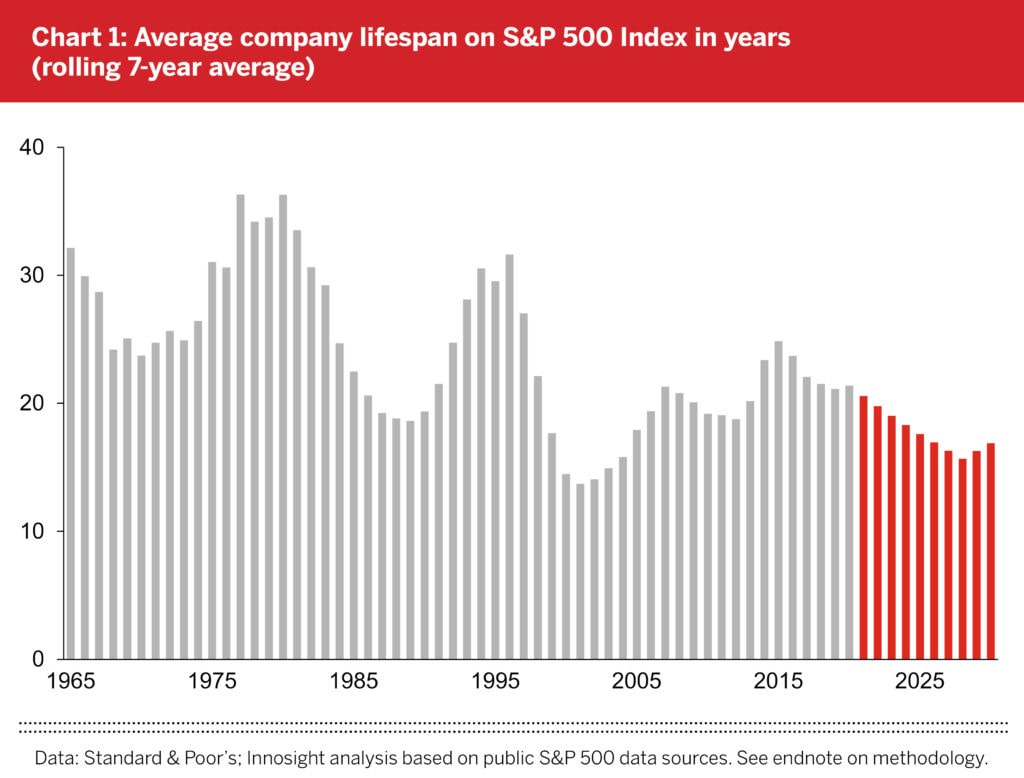
This is echoed by the average holding period of stock by investors.

Perhaps it’s the speed of the world, perhaps it’s greater expectations than ever before - but what I read from this is that there is no mercy. When you create a company, if you do well, you are given the capital and liquidity to go out and become a massive growth engine, and anyone not at the highest level is cut. It’s a quick rise and quicker fall from grace if conditions warrant it. Perhaps it can be too quick to punish, but this only benefits us longer term.
Bottom line?
The dynamism of the S&P500 is what makes it a powerhouse. Although it is really weird that the biggest passive investment vehicle index is based on an arbitrary committee - a fact I do not think many people are aware of. I bring this up to just bring the mechanics of indexes to light so we can better understand underlying market dynamics. I can only imagine how that committee gets front-run.
When we paint market doom and gloom headlines with such broad strokes, we sometimes forget that at the end of the day - it is individual companies that make these indexes up. And there is always another amazing company around the block, whose time has come - and there are times when old powerhouses like Sears get kicked to the curb.
Indexes like this don’t discriminate, and it’s cutthroat - the ones that do get included, have a massive amplification effect - which is a positive feedback look, and the reverse is true as well. Give a little bit of time, and these rising starts creep into these indexes and fuel growth in new and innovative ways, accounting for the multi-sided changes in the world around us.
What does that mean by the dip? Maybe - but more than that, it’s why a long-term focus works and is advocated for - and perhaps this is a different view on why that actually makes sense - not just good a good sales pitch for indexing.